NARIX by the numbers: Denver 2025
Each NARIX, as the application window closes and acceptance letters go out, we take a moment to analyze the data and reflect on the most recent application window. Our learnings and reflections are published in our “NARIX by the Numbers” blog posts, as a look into what happened and how decisions were made. This post is now our fifth.
For folks who are interested, here are our previous NARIX by the Numbers posts:
When these posts started, they served to explain our waitlist process and provide some visibility into the geographic breakdown of applications. Over time, we added other data points, like demographic data (age, race, gender, disability, etc), and unconference experience/rope roles, so that we could measure the impact of our programs and initiatives.
This year, we asked additional questions surrounding specific disability identities and upgraded the “anti-racism” question, now called the “inclusion” question. Without further ado, let’s get into it. And a quick note before we start: this is our new steerco member Hazel’s first time doing this analysis, so be nice! :)
Applications at-a-glance:
108: The number of applications we received.
As the world changes, we see an impact on attendance of rope and kink events everywhere, and NARIX is not an exception. We received feedback from former and aspiring attendees that with the economy in decline, and the growing concerns around safety of traveling (not only across borders, but to kink events), they would be waiting to see what the next year brings. This year, we received 108 applications, down significantly from the over 200 applications we had for Austin. On the plus side, since the venue could not accommodate the large number of attendees we have had previously, we also had a much shorter waitlist than previous events.
70: The number of spots open for the Denver event.
As mentioned above, a smaller event and a smaller applicant pool meant that most of the folks who applied were offered spots. We are expecting a more intimate and connective event, similar to the ones that pre-dated the COVID-19 pandemic.
Applicant demographics
Almost two years ago now, we added demographic questions to the application. These questions are optional, and are accompanied by the following text on the form:
“Why collect this information?
NARIX is committed to hosting a diverse, accessible, and equitable event. To help us achieve that goal, please let us know how you identify within any of the following groups. Please answer to your comfort level, all of the following section is optional.
How is this information used?
We collect demographic information to track change over time, and to measure the impact of our outreach programs. We also share out this data with our community (in an anonymized way) via our "NARIX by the Numbers" posts, which can be found on our blog.
We believe “you can’t improve what you don’t measure”. We’ve used this data to track larger systemic change over time, and also to notice trends in how the data changes as we change where our events are located.
On Age
By percentage, our age breakout for Denver applications looks pretty similar to Austin, with more attendees in the “26-40” age group than any other by a wide margin. We observed a decrease in the percentage of applicants in the 18-25 range, accompanied by a slight increase in our 56+ crowd.

At Montreal NARIX in 2024, the meet-up for older folks in rope resulted in an instagram account dedicated to increasing representation of older folks in rope (shameless plug to follow that account here: https://www.instagram.com/older_people_shibari/ ).
On Race and Ethnicity
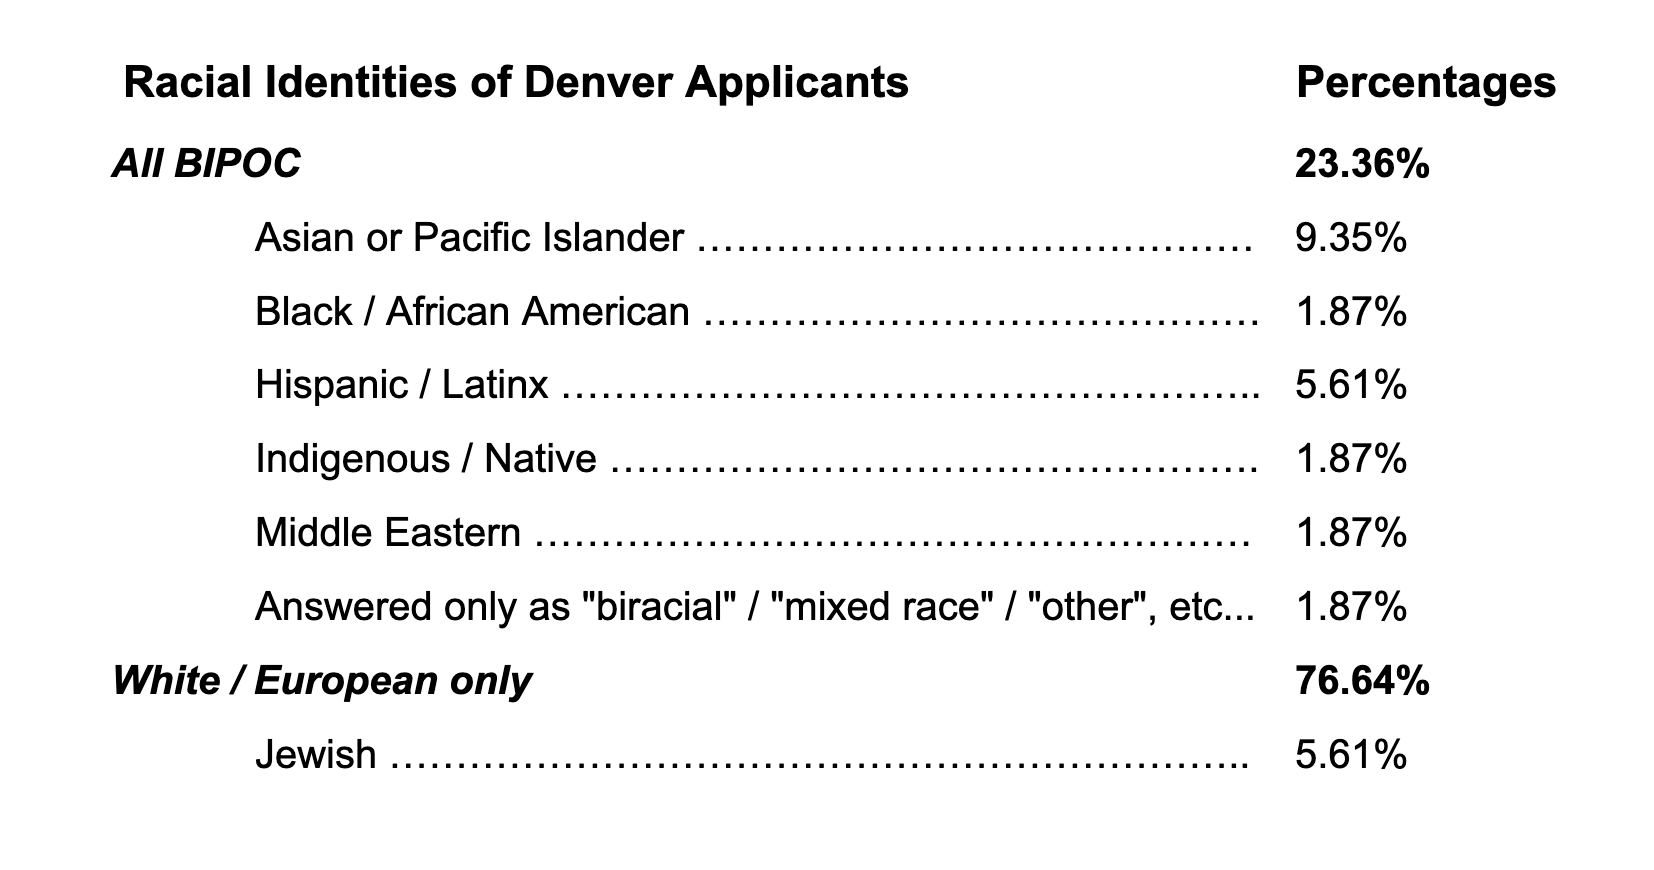
In our most recent application window, we saw 76.64% of applicants identifying only as white or European, and 23.36% of applicants identifying with some other racial identity. This is down from when we hosted in Austin, where white applicants made up 69% of the pool. Some of this can be related to the change in location, changes in felt safety for traveling, and also in response to changes that NARIX is working through making as an org (more on those here).
For the table below, we’re reporting on the number of applicants who claim each racial identity, which allows us to show you how many applicants identify as Black or Asian, even when an applicant answers as both. While people may be double-counted as both Black and Asian, the overall percentage for white and BIPOC folks does reflect the overall applicant pool.
How does the applicant pool compare to our final attendee numbers? 37% of NARIX attendees confirmed for this event next week are BIPOC.
On Geographic Breakdown
This NARIX, we saw some new additions to our map from last time, with applicants from Idaho, Morocco, and Vermont! As always, the majority of our pool came from California (LA & San Francisco), Washington (Seattle), New York, Illinois (Chicago), and our host city of Denver, Colorado.
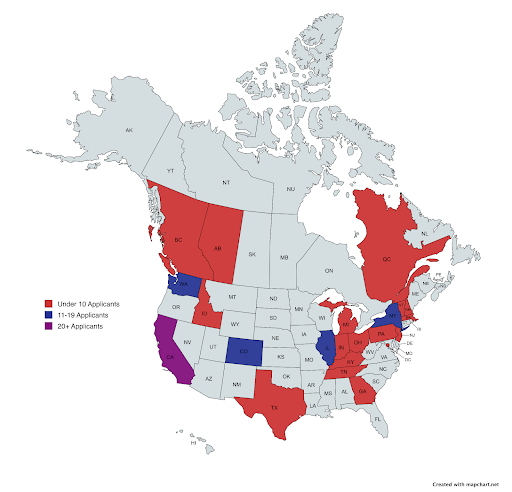
Note: Not pictured on the map is under 10 applications from Morocco, Mexico, and unspecified Canadian regions.
On Gender and Sexuality
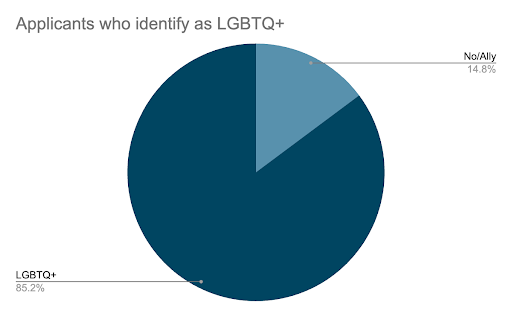
When it came to gender identity, 42.5% of applicants identified as trans or gender non-conforming, and 85.2% identified as LGBTQIA+ in some way. Both of these numbers increased significantly from the last NARIX!

On Disabilities
This application round, we did something new (shocker!). This time, we asked applicants to note not only if they had a disability, but also to choose where they felt it fell based on the categories our Accessibility team helped us develop. They are as follows:
Vision
Hearing
Speech
Mobility, strength, or dexterity
Remembering, concentrating, or paying attention
Intellectual or learning
Emotional, psychologica,l or mental
Pain
Respiratory
None
I prefer not to say
Of these categories, we saw the most reports of disabilities related to concentration and remembering, as well as emotional, psychological/mental health issues. Only 34.9% of applicants reported not having a disability.

An update to the Application Process… again
Before this event cycle, we published a blog post discussing the changes we were making, but for those who haven’t read it yet, here is the TLDR:
We added disability information to our demographic data question to monitor and improve our own event’s efforts at disability inclusion.
We updated the anti-racism question (now the “Inclusion” question) to include a wider range of identities, make it more straightforward, and invite a broader range of possible answers (using the Situation-Behavior-Impact format that our harm question uses today).
Our initial reasoning for adding the question in the first place and our “anti-racism” initiatives can be found here: https://www.narix.org/blog/our-antiracism-initiatives
We have made a major update to our website, incorporating more information about the event, our volunteers, and our processes.
[Please] Check it out: https://www.narix.org/
We added the evaluation criteria for each of the essay questions to be reviewed before applications went out, so applicants have a clearer idea of what we look for in answers.
Check it out: https://www.narix.org/applicationprocess
We added an appeals process for those who had their application denied to give them an opportunity to better communicate their answer, or provide context we were missing in person.
Check it out: https://www.narix.org/appeal-process .
We got a little more transparent about our acceptance process
Check it out: https://www.narix.org/blog/our-current-application-process
Some other interesting data to share:
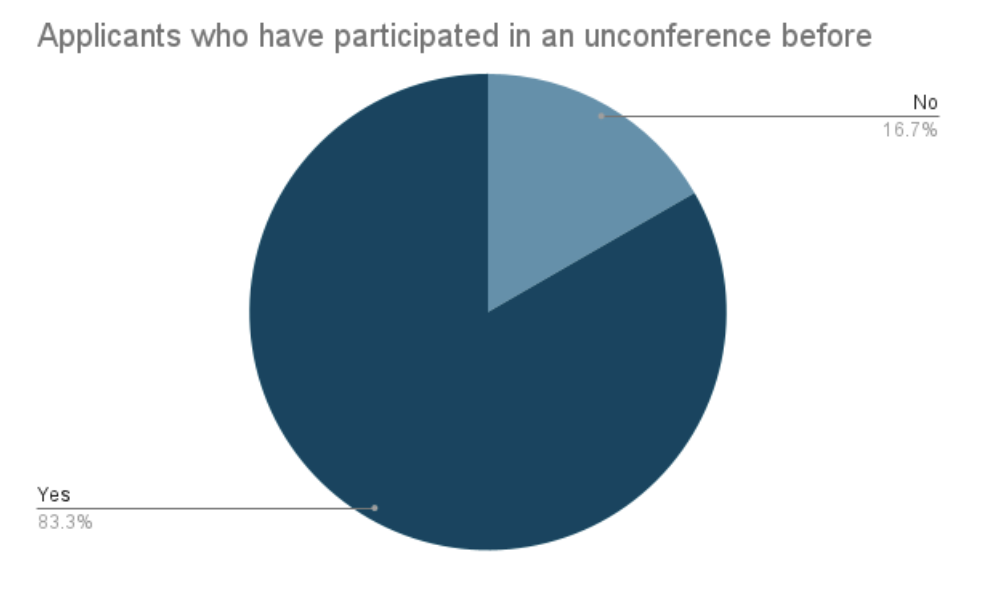
18: The number of applicants who have never attended an unconference (or previous NARIX)
In our unconference experience, we’re seeing more and more that applicants have attended these kinds of events. That’s great news! And from what we can tell by answers in the application, this results from more small regional unconference events being hosted in local communities throughout the year.
28: The number of self-tiers who applied
On our identity distribution, we stayed pretty consistent with the trends we have seen lately, with a good distribution between Tops and Bottoms, and increases in Switches and Self-Tiers.

The final numbers
Here’s our usual rapid-fire stats, for the other nerds who love these things:
23: the number of folks who were put on the waitlist
554: the number of emails that went out this cycle related to applications
56: the number of folks who contributed to the scholarship fund (another very exciting increase!)
13: partial or half scholarships funded by the folks above
101: the number of attendees who said “Yes” or “Maybe” to volunteering during the event– up over 20+ from the last event (again!)
7: the number of sessions we can hold at a time
51: the number of committee meetings held to get ready for the event (not counting the 1-1 chats or intercommittee meetings required to get things moving)
And of course, 7. The number of days between now and Denver NARIX, when we open the doors to welcome attendees to another vulnerable, challenging, collaborative, inspiring event.