LA NARIX, by the numbers
Acceptance letters have been sent out, folks are buying plane tickets and booking airbnbs and hotel rooms, and session brainstorming is well underway. As we head into our next NARIX, we’re continuing the tradition of a post-application “NARIX by the numbers” blog, to let you know transparently how we’re managing the application process, and what trends we’re seeing in our applicant pool.
Let’s start with the application process:
This was our first time operating with an application cap, and going in, we had very little idea of what to expect. We opened applications late Thursday night, on June 15th. Applications closed after ~6 days on Tuesday June 21st, when we hit our cap of 150*.
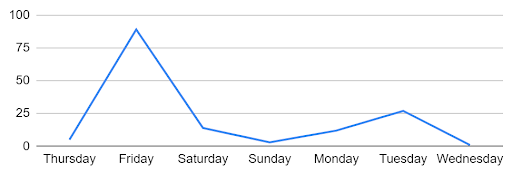
The applications rushed in on the first full day, and quickly slowed down as word spread that they were open. We saw the most applications (89) on day 1, and then the second most applications (27) on the final day, when we announced that we were getting close to the cap.
*We did let in one late application in the wee hours of Wednesday morning, from someone who’d been working on theirs literally as we closed the form.
In terms of demographics:
This was also the first time we really collected and monitored demographic data among our attendees. The four main categories we asked about were Age, Race/Ethnicity, Sexual Orientation, and Gender Identity. For sexual orientation and race & ethnicity, applicants had the ability to select more than one option.
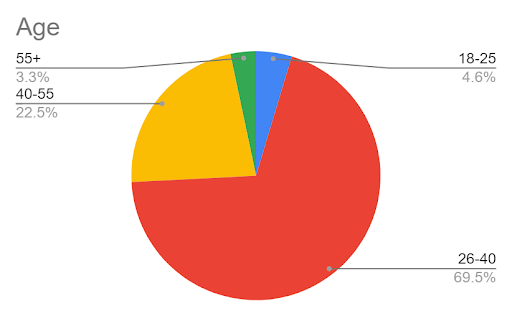
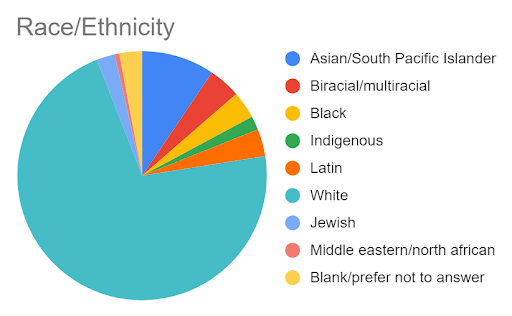
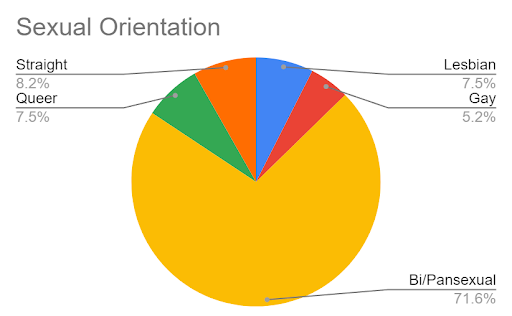
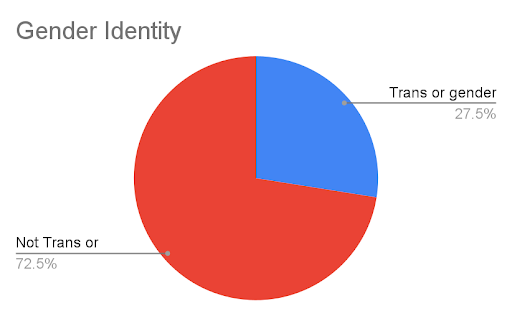
Because we don’t have previous data to compare this to, we can’t draw many conclusions about how things are changing over time. But we’ll continue to collect this, and share as a snapshot into who’s applying to NARIX.
Now, for the geographic breakdown:
This information we DID collect for our last NARIX, and so here we can compare over time. If you need a quick refresher, our Philly blog post had some strong local representation from Pennsylvania and New York in the applicant pool.
Of course, as expected, our LA event is seeing strong turnout from local Californians, and it looks like we maintained interest from our East Coast friends, even with the distance. Our top 5 regions were: California, Illinois, Washington, New York, and Texas.
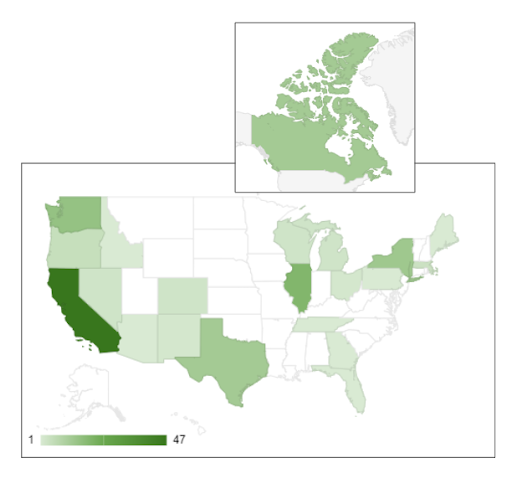
(And yet again, we get to face the frustration of Google Sheets– that we can’t split up Canadian maps by province (if you’re curious, it’s Alberta (7), Montreal (2), and Quebec (1), for 10 total).)
How about the rope roles? Tops, bottoms, switches, self-suspenders?
This was another “select as many as apply”, so we definitely have more responses than people for this one. We did collect this info last year, though it didn’t make it into the “by the numbers” post. We’ll share it now, for comparison.
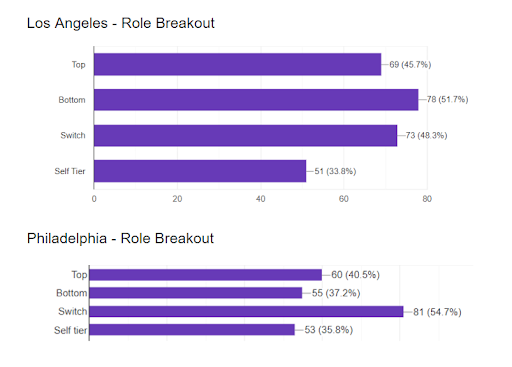
Knowing that there’s overlap in how folks are selecting, it does generally look like we’ve got more switches represented in the LA applicant pool, both in raw numbers and in proportion. We also saw much bigger turnout among bottoms this season, from 55 in Philly to 78 in LA.
Finally, let’s close out with some rapid fire numbers:
151: The number of applications received for Los Angeles NARIX this fall.
29: The number of accepted applicants who had reserved spots, whether it was because they were critical event staff, or because they deferred their Philly acceptance.
52: The number of people who are currently on the waitlist.
100: The number of attendees we expect at the event.
352: The number of emails sent this week. 27 more than last time around, we’ve outdone ourselves– and hopefully you all agree- our emails are much improved over last time too.
6: The number of scholarship tickets funded by donations from attendees.
And finally, our favorite – 97 – the number of days between now and October 26th, the first night of NARIX. The moment the work pays off, and the doors open to invite you in.
See you in Los Angeles! <3